Faculty Mentor:
Ms. Ankita Chopra
Student Name:
Shubham Dubey (MCA-III)
Shivam Goel (MCA-III)
1. INTRODUCTION
Data Science is a blend of various tools, algorithms, and machine learning principles with the goal to discover hidden patterns from the raw data.In its most basic terms, it can be defined as obtaining insights and information, really anything of value, out of data.Data science, when applied to different fields can lead to incredible new insights.
2. THE NEED FOR DATA SCIENCE
Traditionally, the data that we had was mostly structured and small in size, which could be analyzed by using the simple BI tools. Unlike data in the traditional systems which was mostly structured, today most of the data is unstructured or semi-structured. Let’s have a look at the data trends in the image given below which shows that by 2020, more than 80 % of the data will be unstructured.
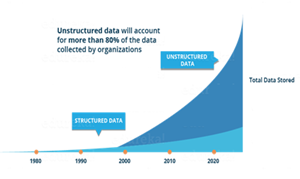
Fig-1 NEED OF DATA SCIENCE
This data is generated from different sources like financial logs, text files, multimedia forms, sensors, and instruments. Simple BI tools are not capable of processing this huge volume and variety of data. This is why we need more complex and advanced analytical tools and algorithms for processing, analyzing and drawing meaningful insights out of it.
This is not the only reason why Data Science has become so popular. Let’s dig deeper and see how Data Science is being used in various domains.How about if you could understand the precise requirements of your customers from the existing data like the customer’s past browsing history, purchase history, age and income. No doubt you had all this data earlier too, but now with the vast amount and variety of data, you can train models more effectively and recommend the product to your customers with more precision. Wouldn’t it be amazing as it will bring more business to your organization?
Let’s take a different scenario to understand the role of Data Science in decision making. How about if your car had the intelligence to drive you home? The self-driving cars collect live data from sensors, including radars, cameras and lasers to create a map of its surroundings. Based on this data, it takes decisions like when to speed up, when to speed down, when to overtake, where to take a turn – making use of advanced machine learning algorithms.
Let’s see how Data Science can be used in predictive analytics. Let’s take weather forecasting as an example. Data from ships, aircrafts, radars, satellites can be collected and analyzed to build models. These models will not only forecast the weather but also help in predicting the occurrence of any natural calamities. It will help you to take appropriate measures beforehand and save many precious lives. Now that you have understood the need of Data Science, let’s understand Life Cycle of Data Science.
3. LIFECYCLE OF DATA SCIENCE
Here is a brief overview of the main phases of the Data Science Lifecycle:
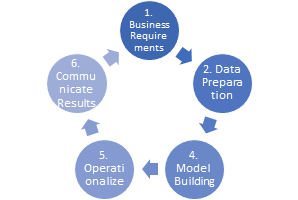
Fig 2: Phases of the data science lifecycle.
3.1 Business Requirements: Data scientists need to work with business people and those with expertise in understanding the data, understanding the business , specify the business requirements, for instance, the healthcare data.
3.2 Data preparation: In this phase, you require analytical sandbox in which you can perform analytics for the entire duration of the project. You need to explore, pre-process and condition data prior to modelling. Further, you will perform ETLT (extract, transform, load and transform) to get data into the sandbox. You can use R for data cleaning, transformation, and visualization. This will help you to spot the outliers and establish a relationship between the variables. Once you have cleaned and prepared the data, it’s time to do exploratory analytics on it. Let’s see how you can achieve that.
3.3 Model building: In this phase, you will develop datasets for training and testing purposes. You will consider whether your existing tools will suffice for running the models or it will need a more robust environment (like fast and parallel processing). You will analyse various learning techniques like classification, association and clustering to build the model.
3.4 Operationalize: In this phase, you deliver final reports, briefings, code and technical documents. In addition, sometimes a pilot project is also implemented in a real-time production environment. This will provide you a clear picture of the performance and other related constraints on a small scale before full deployment.
3.5 Communicate results: Now it is important to evaluate if you have been able to achieve your goal that you had planned in the first phase. So, in the last phase, you identify all the key findings, communicate to the stakeholders and determine if the results of the project are a success or a failure based on the criteria developed in Phase 1.
4. THE DATA SCIENCE TOOLS
4.1 R Programming: The R programming is a statistical programming language that is equipped with a wide range of features, functionalities. It has been the most promising language when it came to data analytics and machine learning.
4.2 SQL: SQL refers to the structured programming that is used to work with relational database management systems. This SQL is useful for data follows a certain format like the row and column standard type that is used to depict a huge amount of data even in today’s world of unstructured data. SQL is extensively used by database administrators and developers alike.
4.3 Python Python is a high-level, powerful, object-oriented programming language that is highly versatile. It is used for a variety of applications but none more important than in the data science domain and machine learning applications. It has a huge set of libraries that is one of the distinct features of Python programming language.
4.4 Hadoop This is a tool used for big data applications and it is the most powerful as well as an open source solution. It has a huge ecosystem that comprises of some of the best tools for working with big data. You store, compute, deploy real-time analytics among things on big data through the Hadoop and its ecosystem of tools.
4.5 SAS SAS is a powerful business intelligence and analytical tool. It is a software suite for extracting, analyzing and reporting on a wide range of data and derive valuable business insights from it. It includes a whole set of tools for working across the various steps of converting data into business insights.
4.6 Tableau This is the most powerful data visualization, analysis and reporting tool. The best of Tableau is that you don’t need any technical knowledge or programming skills in order to derive valuable insights from Tableau.
5. ADVANTAGES OF DATA SCIENCE
1. Data science helps the management to come up with better and faster decisions
2. It empowers the decision-makers with solid data and outlines a path to achieve business goals
3. We can anticipate new challenges and opportunities through the power of data
4. Spotting trends and capitalizing on it before the competition
5. Setting the guidelines for best practices and tried and tested methodologies
6. Rigorously testing the decisions until it achieves perfection
6. REQUIRED DATA SCIENCE SKILLS
It is a field which requires a specific skill set comprising of expertise in following:
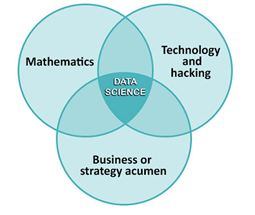
Fig-3 DATA SCIENCE SKILLS
1. Mathematics – In order to understand a complex web of unstructured data requires a combination of heuristics and quantitative analysis to provide solutions to the prevailing problems. Many a times the business problems require analytical models to be prepared in order to resolve them and knowledge of data analysis is a must. Nowadays advanced analytics tools like SAS are being extensively deployed for getting increased insights.
2. Technology and hacking – Data scientists are supposed to have a solid technical knowledge about breaking up and solving problems by creating complex and solvable Data Science algorithms. Data science requires the expert to think like a data analyst through the high-dimensional data and data control flows. Here by stating Hacking, should not be taken as literal hacking the computers and unethical intrusions.
3. Business or strategy acumen – One of the important pillars of data science is business or strategic insights. Along with an expertise in mathematics and technological skills, a clever and deep insight in business is also required to become a complete package for data scientist’s job. A sharp vision that could predict the future trend and prepare the strategy to deal with it beforehand is what companies want now a days to survive in this cut-throat competition.
7. CONCLUSION
Data Sciences is about exploring and analyzing large amounts of data (Big Data). Goal is to discover meaningful trends, patterns or insights and translate them into an application. Behavioral prediction, fraud detection, geographic analyses, social media analyses, new medical and social insights. Data science can add value to any business who can use their data well. From statistics and insights across workflows and hiring new candidates, to helping senior staff make better-informed decisions, data science is valuable to any company in any industry.
The power of data lies in the analysis, finding data structures and patterns by displaying the main characteristics of the dataset. A lot is going to happen in the field of Data Science. We are at the beginning.
8. REFERENCES
1. https://www.edureka.co
2. https://intellipaat.com/
3. https://www.DataAppLab
4. https://en.wikipedia.org/wiki/Data_science
5. https://www.youtube.com/watch?v=xC-c7E5PK0Y